The Dashboard
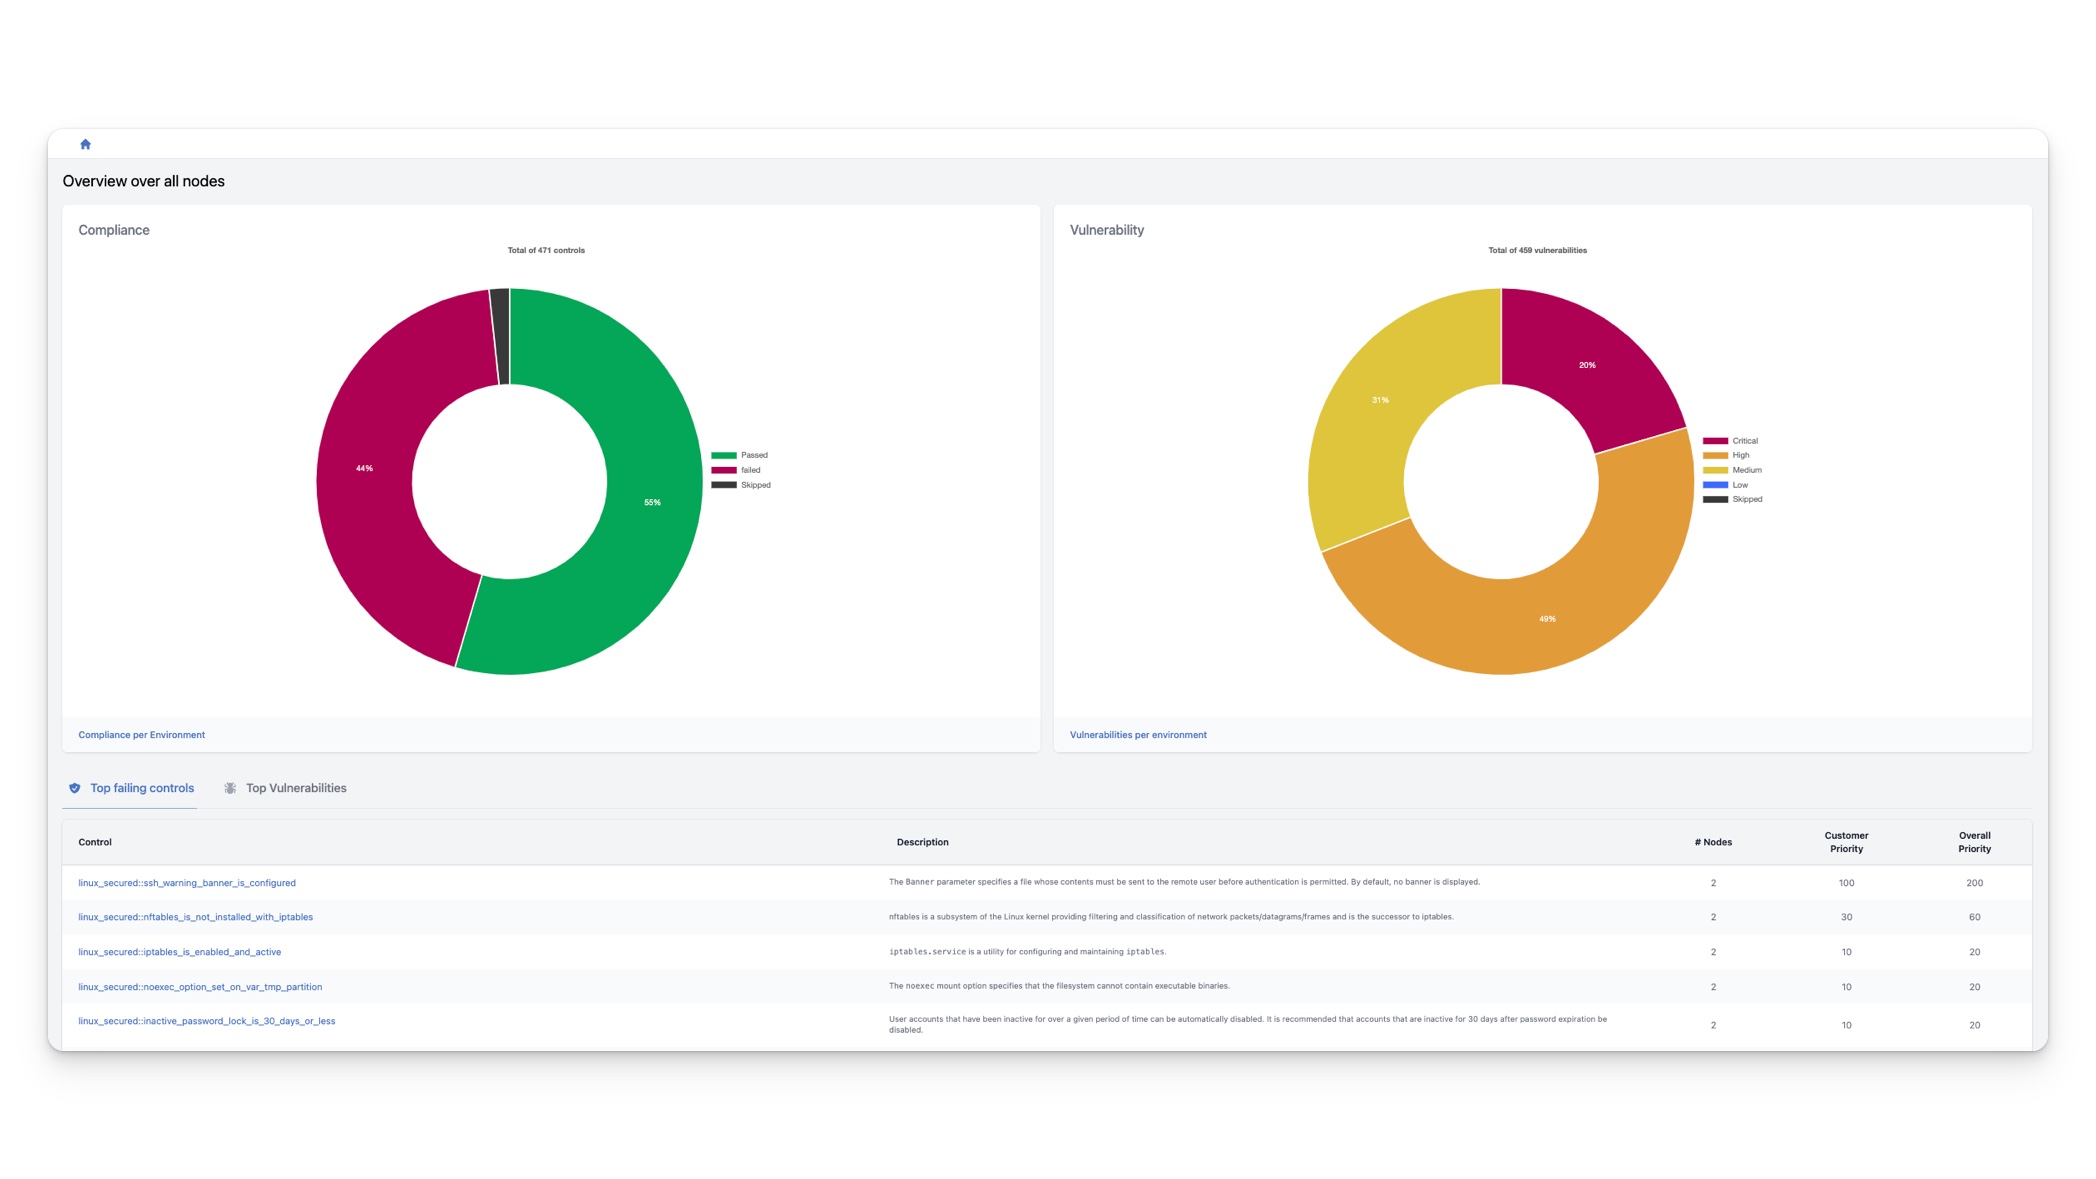
Once you have logged in to the InControl Console, you will be directed to the dashboard. The dashboard offers a quick overview of the compliance and vulnerability status of your entire IT infrastructure.
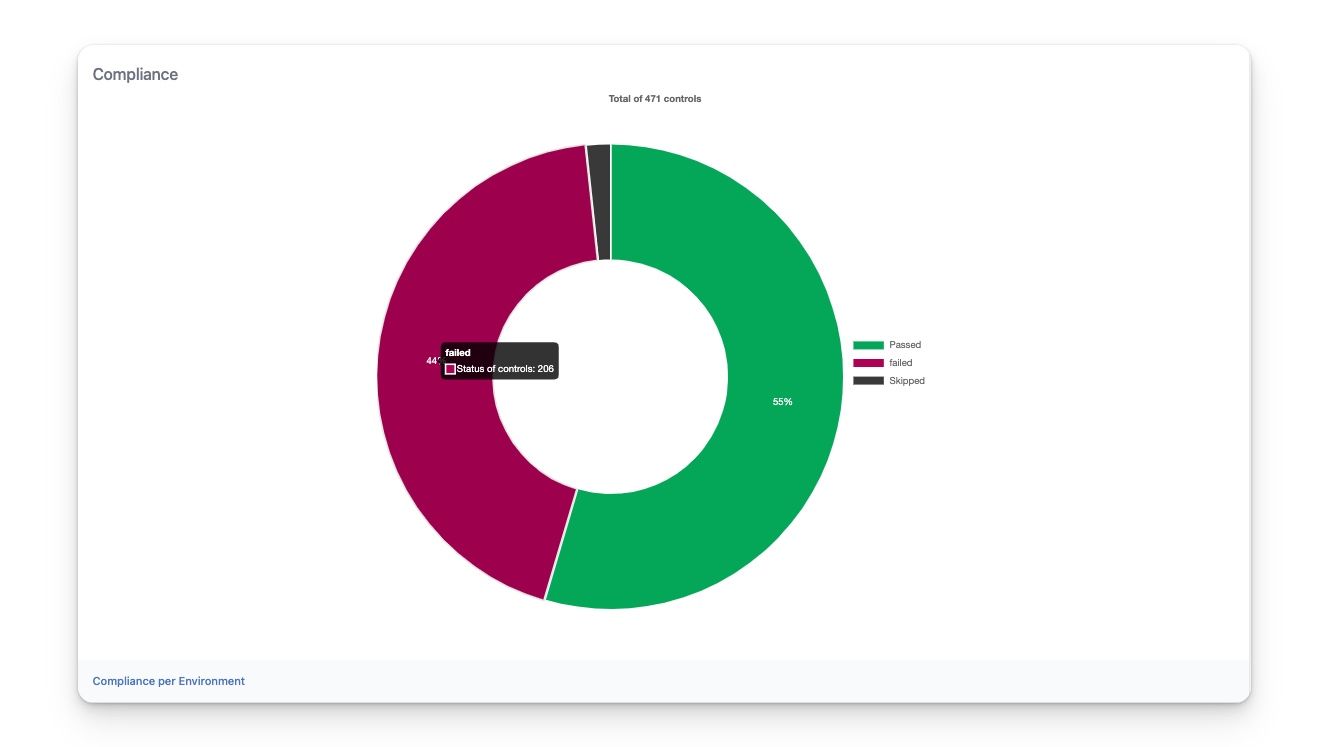
The compliance graph
The graph on the left displays statistics for compliance controls across all nodes in your infrastructure. At the top of the graph, you can see the total number of controls across all nodes. The graph shows the percentages of failed, passed, and skipped controls. If the same control is applied to multiple nodes, it is counted as multiple controls. For example, suppose you have the control linux_secured::ssh_warning_banner_is_configured applied to 100 nodes. If it passes on 30 nodes and fails on 70 nodes, this is counted as 100 controls in the graph, where 70 are used to calculate the overall failing percentage and 30 are used to calculate the overall passing percentage.
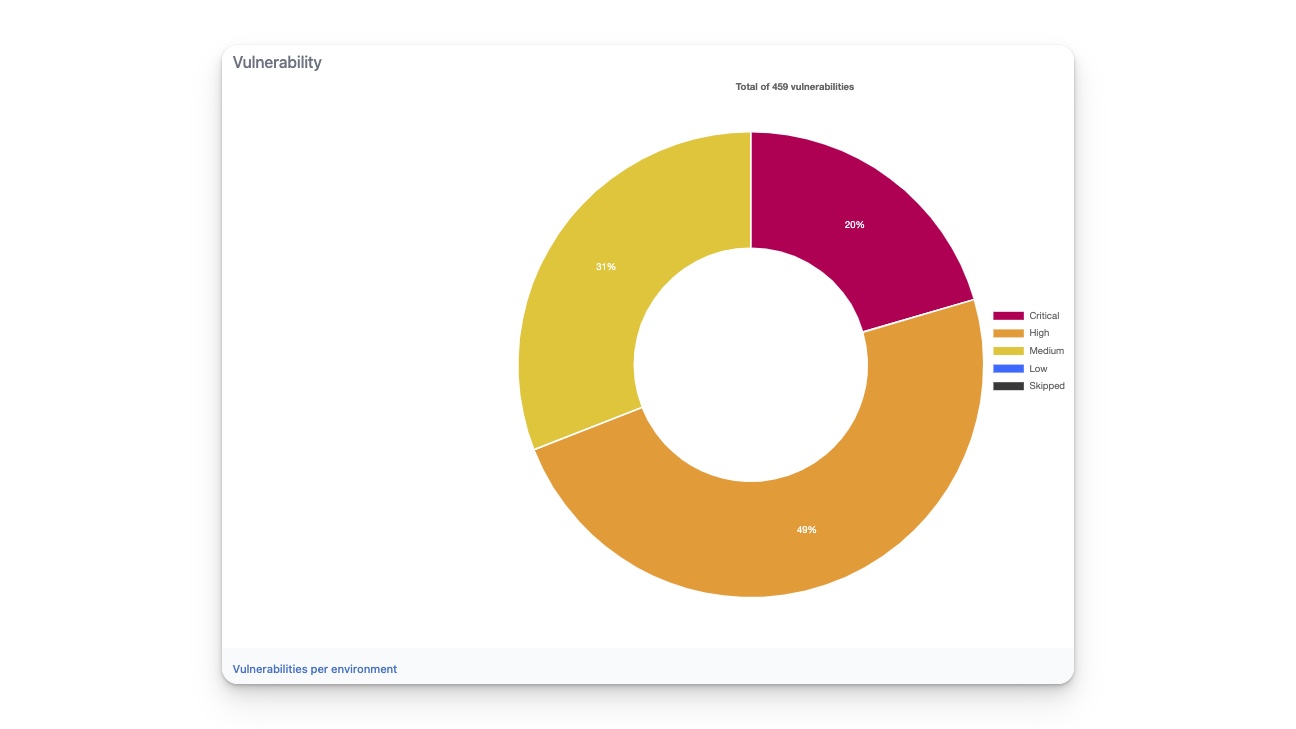
The vulnerability graph
The graph on the right displays the statistics of all detected vulnerabilities across all nodes in your infrastructure. At the top of the graph, you can see the total number of detected vulnerabilities on all nodes. The graph shows the percentages of critical, high, medium, and low vulnerabilities.
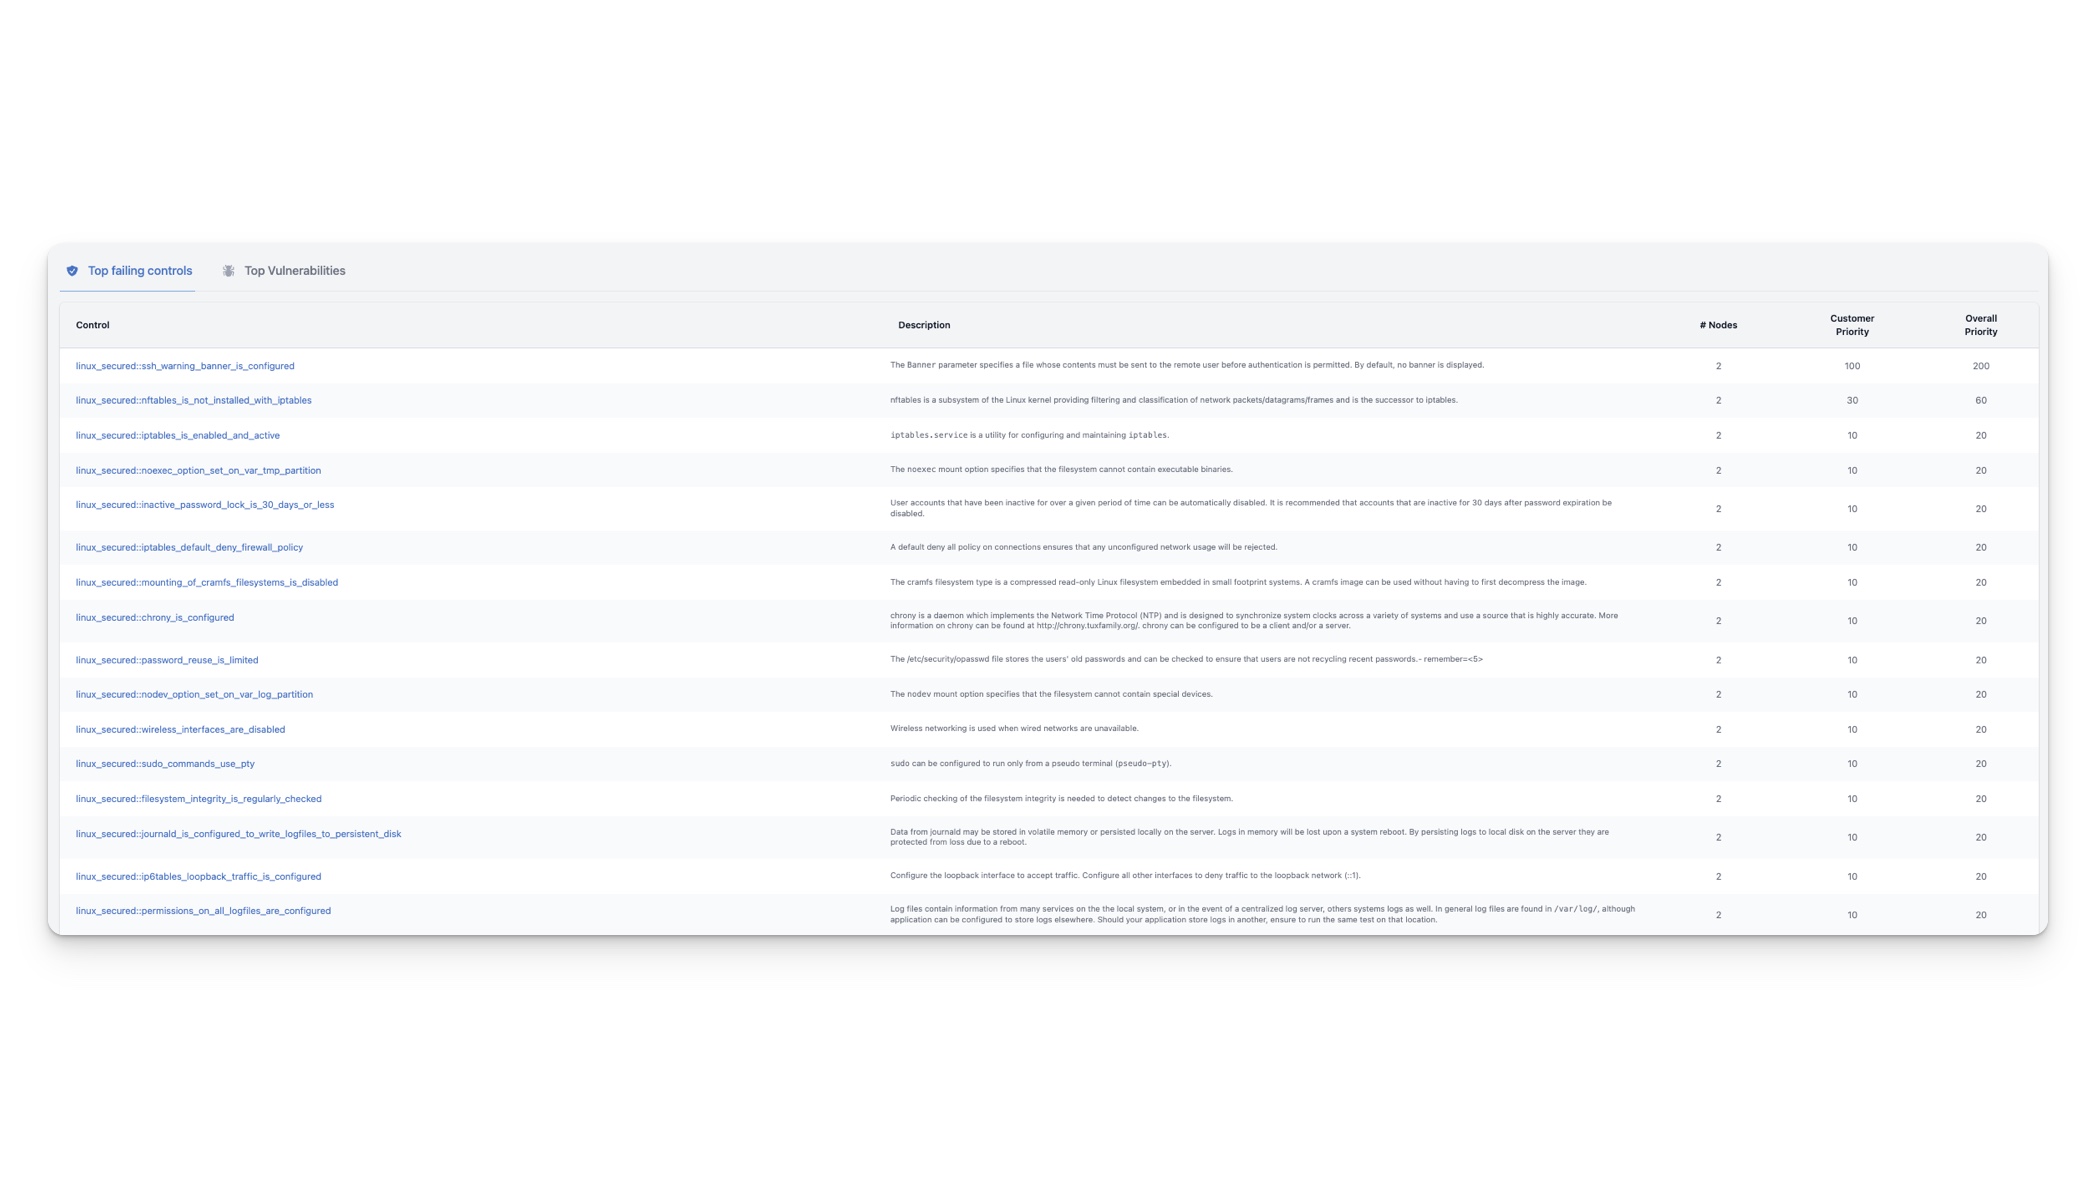
Tab Top failing controls
The tab titled Top failing controls displays the most important controls that require attention. The list is sorted based on the Overall Priority, which is calculated by multiplying the number of nodes the control is failing on (# Nodes) with the Customer Priority. You can set the customer priority for individual controls by following the instructions provided here.
By default, all controls have the same priority of 20. This means that the number of nodes a control is failing on determines its position on the list.
This list is an excellent resource to share with your DevOps and/or SRE teams as it identifies the issues that require top priority for resolution.
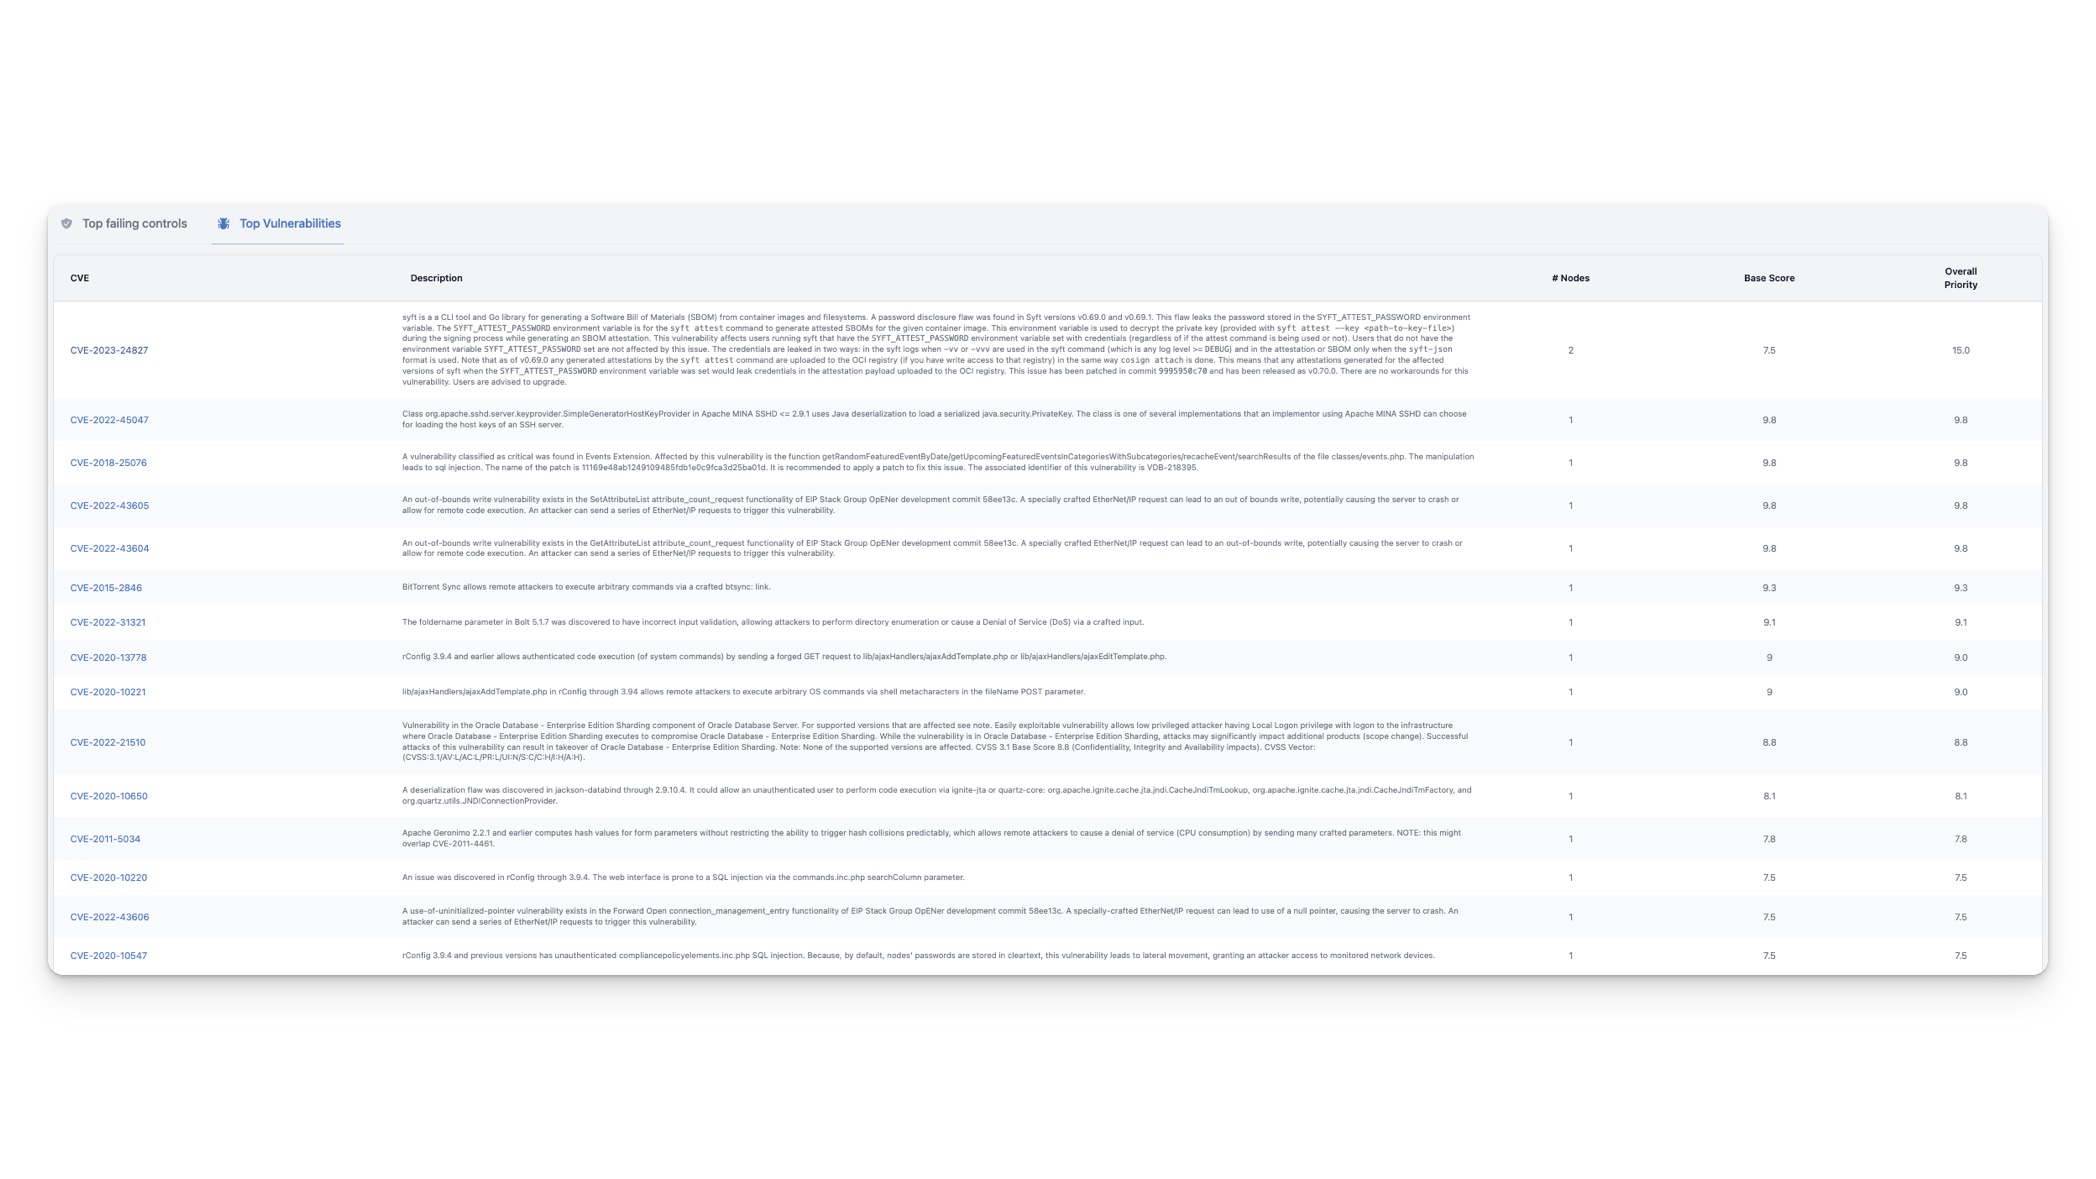
Tab Top Vulnerabilities
The tab Top Vulnerabilities displays the most critical vulnerabilities that require your attention. The list is sorted based on the Overall Priority, which is determined by multiplying the Base score with the number of nodes where the vulnerability is detected. The Base score is an intrinsic property of a CVE that indicates the overall severity of the vulnerability. A higher base score indicates a more severe vulnerability. For more information about CVE scoring, please refer to this link.