Vulnerability Reports
This section provides a comprehensive view of all vulnerability reports across time for every node. By analyzing the trends of the reports, one can gain a better understanding of the evolution of the security posture of the systems. The overview allows for a more thorough analysis of the data, which in turn enables informed decisions to be made regarding the prioritization of security patches and updates. Additionally, by examining the reports over time, one can identify recurring security issues that may require further investigation and remediation. Overall, This section serves as a valuable tool for enhancing the security of the system and mitigating potential vulnerabilities.
Search
In the search field, you can enter different parameters to narrow down the reports shown in the table. For example, you can search for specific node names or Puppet environments to filter out unwanted information.
Reports table
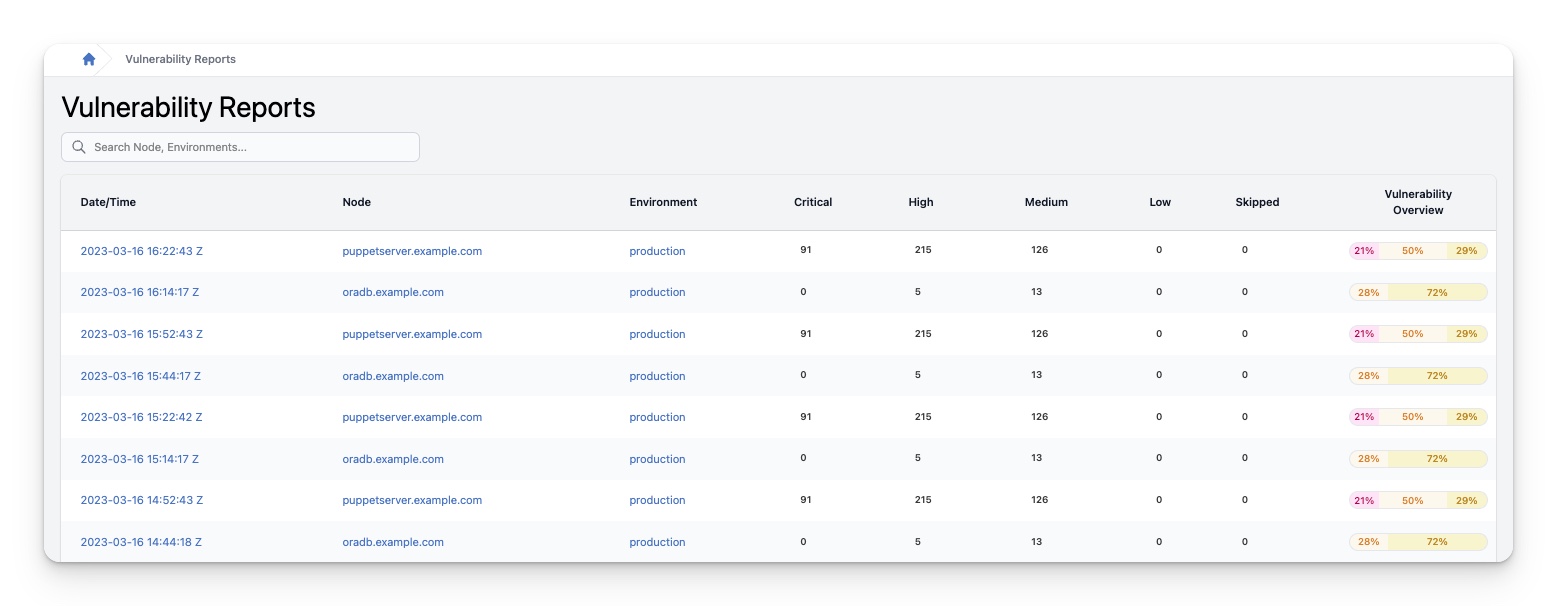
The reports table provides the following information for each compliance report:
| Column | Description |
|---|---|
| Date/Time | The date and time the report was registered in InControl. Clicking this will take you to a more detailed overview of the corresponding vulnerability report |
| Node | The name of the node. Clicking this will take you to the Node details page |
| Environment | The name of the Puppet environment the node is running in. Clicking this will take you to the Environment details page |
| Critical | The number of Critical vulnerabilities in this report. When there are differences compared to the previous report, statistics of the differences will also be displayed. |
| High | The number of High vulnerabilities in this report. When there are differences compared to the previous report, statistics of the differences will also be displayed. |
| Medium | The number of Medium vulnerabilities in this report. When there are differences compared to the previous report, statistics of the differences will also be displayed. |
| Low | The number of Low vulnerabilities in this report. When there are differences compared to the previous report, statistics of the differences will also be displayed. |
| Skipped | The number of Skipped vulnerabilities in this report. When there are differences compared to the previous report, statistics of the differences will also be displayed. |
| Vulnerability Overview | A concise graphical overview of the vulnerability state of the node in this report |
Vulnerability Report details
This section provides an extensive and detailed overview of the selected vulnerability report. The report includes a thorough analysis of the identified vulnerabilities, highlighting their potential impact on the system. Overall, this report is an invaluable resource for anyone looking to enhance the security of their system and protect against potential threats and attacks.
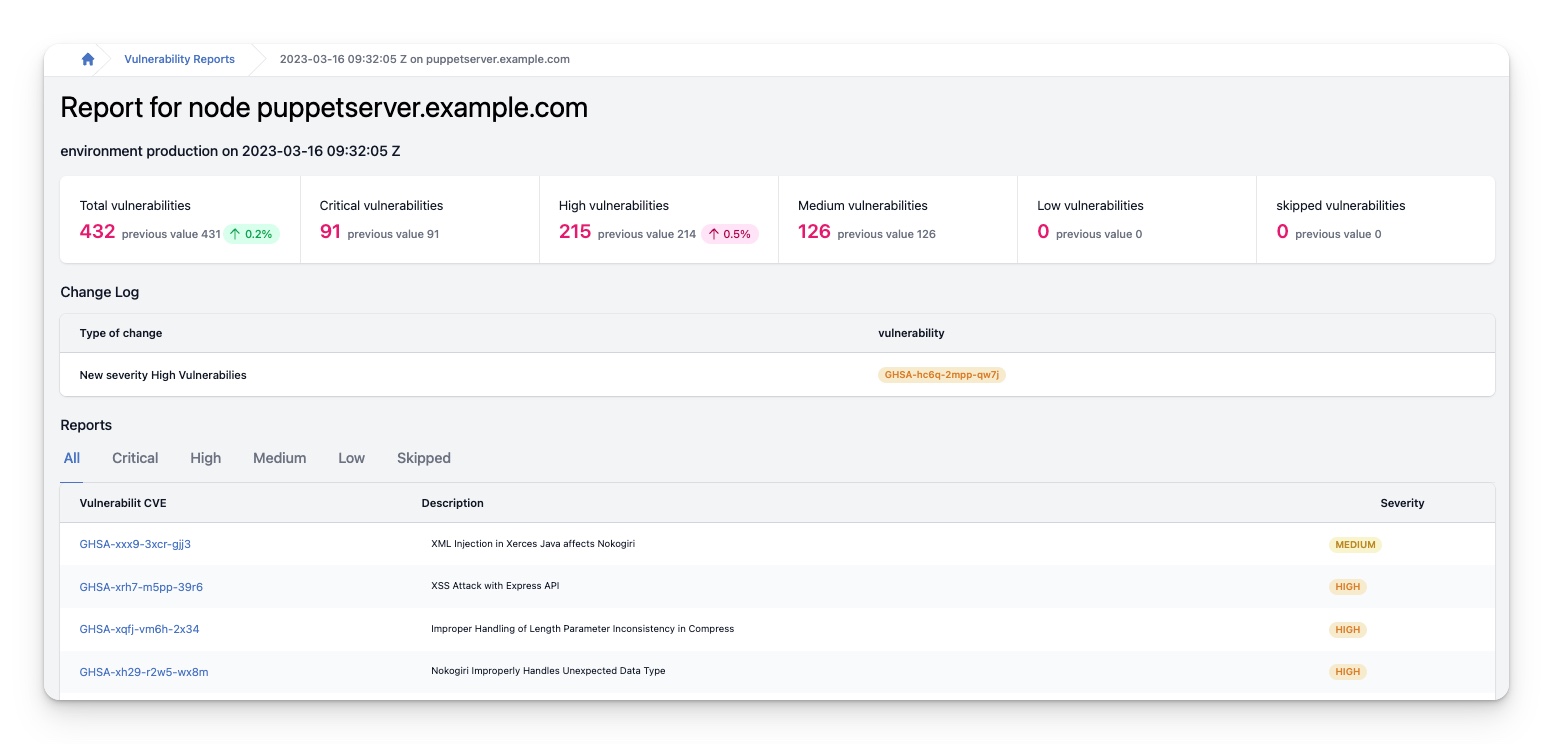
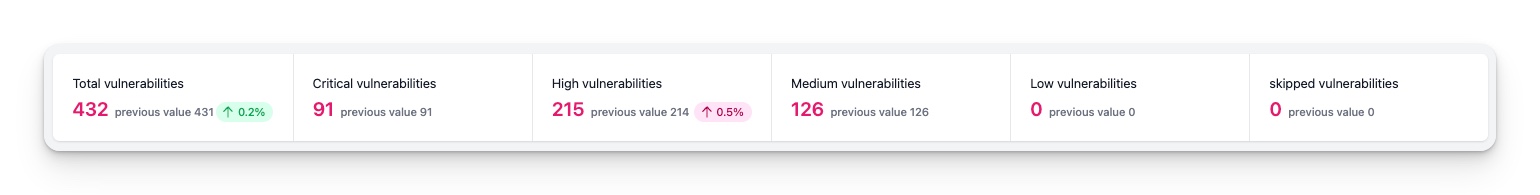
Report statistics
At the top of the InControl page, detailed statistics are displayed to provide you with an overview of your vulnerabilities. These statistics provide information on the number of critical, high, medium, low and skipped vulnerabilities. For each severity, InControl will show you the current and previous numbers of vulnerabilities with that severity. Moreover, if there is a change between the current and previous numbers, InControl will display the difference as an absolute number and as a percentage, so that you can see at a glance how your vulnerabilities have been progressing. The color of the indicator will also inform you whether it is an improvement or a decline. Green indicates an improvement, and red indicates a decline. Therefore, these statistics are incredibly useful for monitoring the progress of your vulnerabilities and identifying areas for improvement.
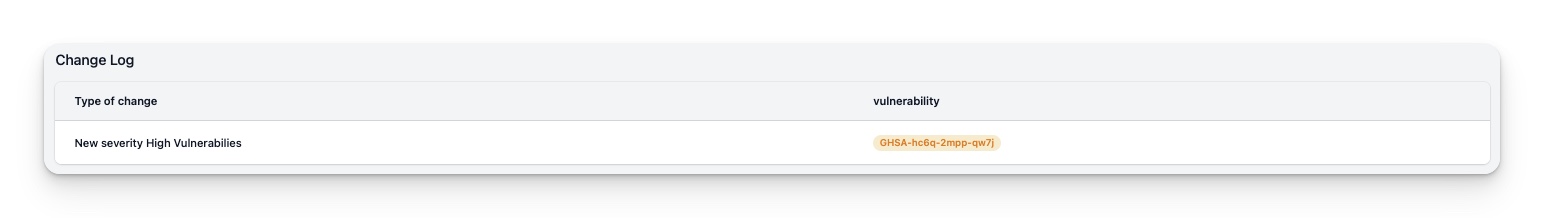
Report change log
While the statistics at the top of the page provide a useful overview, it is important to delve deeper into the data to gain a full understanding of the changes that have occurred. InControl recognizes this need and offers a change log to help users identify the differences between the previous and current reports.
The change log displays a detailed account of what vulnerabilities of what severity have identified, or have been fixed on your systems. Allowing users to gain a comprehensive understanding of the changes that have occurred. By using the change log, you can quickly identify areas that require attention and address them before they become problematic.
Moreover, the log provides a complete history of changes made to the vulnerability state, which can be extremely useful for tracking and auditing purposes. It ensures that all changes made to the vulnerability state are recorded accurately, enabling users to easily review and approve them.
Detected Vulnerabilties
This table contains a list of all the vulnerabilities that where detected as part of this report.
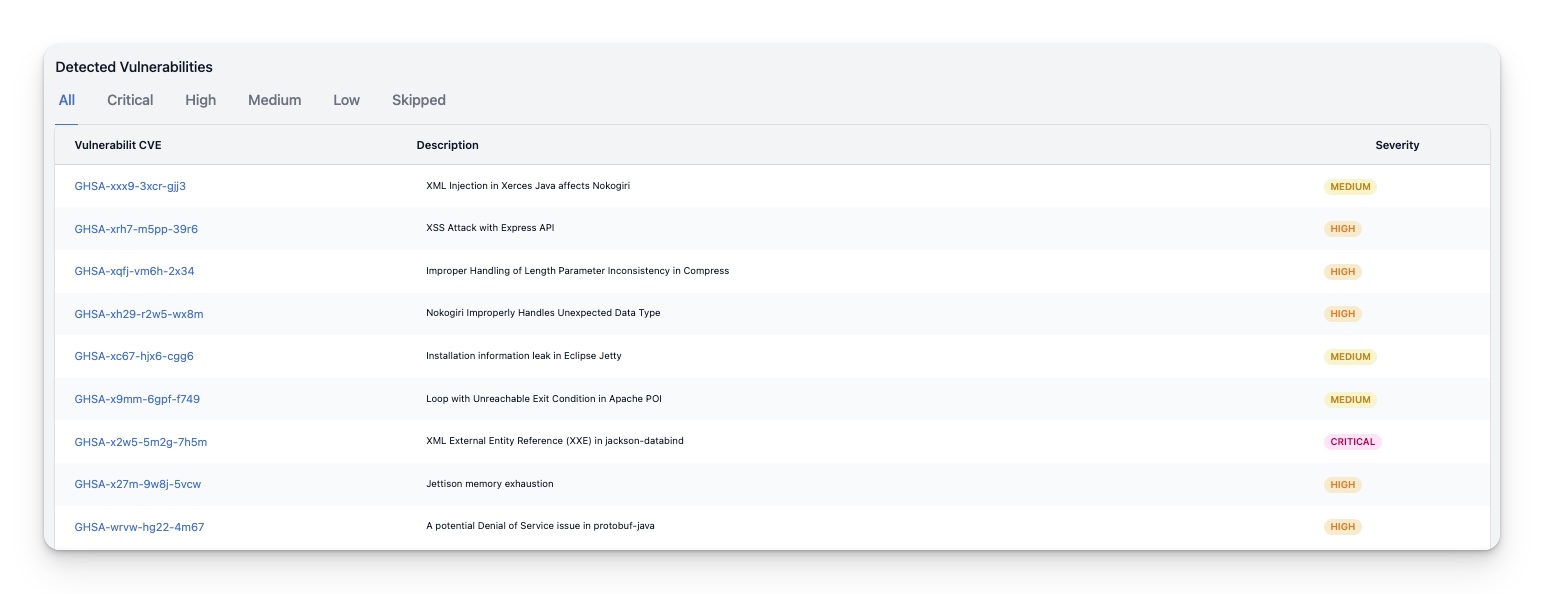
In addition to the default “All” tab, several other tabs are available, including “Critical,” “High,” “Medium,” “Low,” and “Skipped.” This feature allows users to filter and view vulnerabilities based on their severity, which is particularly useful for those who need to focus on specific vulnerabilities or who want to get an overview of the severity of vulnerabilities across all nodes.
| Column | Description |
|---|---|
| Vulnerability | This column shows the CVE number or another identifying number for the detected vulnerability. Clicking on it takes you to the Vulnerability details page |
| Description | This column provides a brief description of the vulnerability. If the column is empty, no short description is provided by the sources. |
| Severity | This column displays the severity of the detected vulnerability. |